ACoS vs TACoS: The Complete Guide to Amazon PPC Metrics
Contents expand_more
You have spent months optimising your Amazon PPC campaigns to hit ACoS targets, but now your agency says you should be tracking TACoS. If you are still taking your first steps in Amazon advertising, we recommend starting with our guide to what Amazon PPC is before diving into advanced metrics. Your dashboard shows both numbers, they tell different stories, and you do not know which one really matters for your optimisation decisions. Optimising the wrong metric wastes advertising budget and can kill profitable growth. Sellers who focus only on reducing ACoS frequently cut campaigns that are generating valuable organic sales, while sellers who do not understand TACoS can continue losing money on every sale because they ignore product margins. This article explains exactly what ACoS and TACoS measure, when to use each metric for different types of decisions, why ACoS alone is dangerously misleading, and how to build a strategic hierarchy of metrics that maximises your total profit.
What Is the Difference Between ACoS and TACoS?
ACoS (Advertising Cost of Sales) measures how much you are spending on advertising relative to the sales those adverts directly generate. TACoS (Total Advertising Cost of Sales) measures advertising spend relative to all your sales, including sales generated by adverts and organic sales. The critical distinction is that ACoS only includes sales directly attributed to advert clicks, while TACoS includes your total sales.
The formulas reveal the difference:
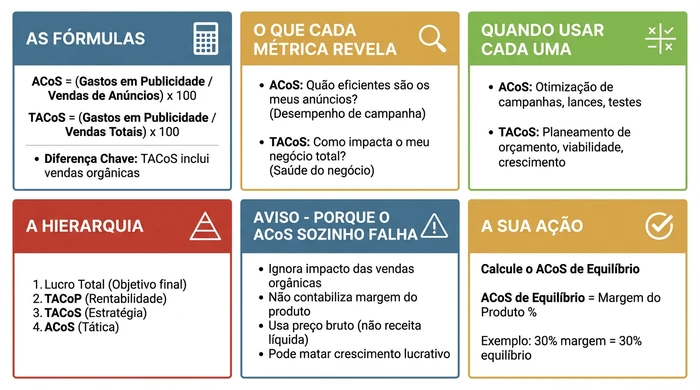
Complete ACoS vs TACoS comparison showing formulas, use cases, limitations and the strategic hierarchy
TACoS is always lower than ACoS because total sales are always greater than or equal to sales attributed to adverts alone. When TACoS is significantly lower than ACoS, it indicates that advertising is successfully driving organic sales. The difference between these two metrics reveals the hidden value of your advertising - the organic momentum it creates beyond direct advert clicks.
| Metric | Formula | What It Measures | Typical Range |
|---|---|---|---|
| ACoS | (Ad Spend / Ad Sales) x 100 | Advertising campaign efficiency | 20-40% |
| TACoS | (Ad Spend / Total Sales) x 100 | Total advertising impact on the business | 7-25% |
How to Calculate ACoS and TACoS
Calculating both metrics requires data from two different Amazon reports. Ad Spend and Ad Sales come from your Amazon Advertising Console, while Total Sales comes from the Business Reports in Seller Central.
For ACoS, you divide your advertising spend by the sales attributed to those adverts. Here is a concrete example: if you spent 500 EUR on adverts and those adverts generated 2,000 EUR in sales, your ACoS is (500 EUR / 2,000 EUR) x 100 = 25%. This tells you that you are spending 25 cents on advertising for every euro of advert-generated sales.
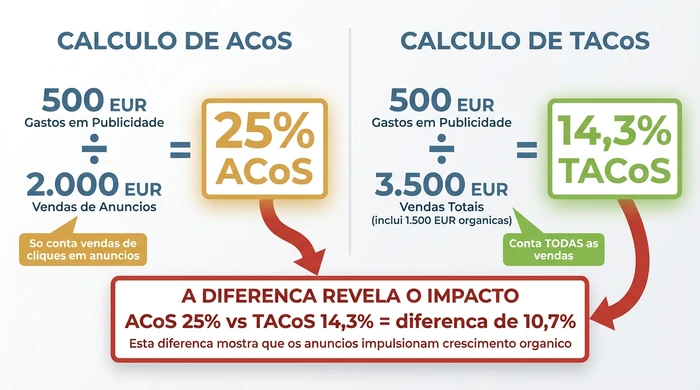
Real example showing how the same advertising spend produces different ACoS and TACoS percentages, revealing the impact of organic sales
For TACoS, you use the same 500 EUR of advertising spend but divide it by your total sales. If your product generated 3,500 EUR in total sales (the 2,000 EUR from adverts plus 1,500 EUR in organic sales), your TACoS is (500 EUR / 3,500 EUR) x 100 = 14.3%. This reveals that advertising accounts for 14.3% of your total business, not just 25% of advert-generated sales.
The common mistake sellers make is forgetting to include all sales channels when calculating TACoS. Seller Central shows total sales across all channels, while the Advertising Console only shows sales attributed to adverts. You need both reports to calculate TACoS accurately.
When to Use ACoS vs TACoS: The Strategic Hierarchy of Metrics
Different metrics serve different types of decisions. Using the wrong metric for a decision leads to optimisation errors that can harm profitability. The fundamental principle is to match the metric to the scope of your decision.
ACoS is your tactical, campaign-level optimisation metric. Use it when you are adjusting keyword bids, analysing search term performance, testing new ad groups or evaluating the efficiency of individual campaigns. For example, if Keyword X has 45% ACoS while your target is 30%, you would reduce the bid by 20% to improve efficiency. ACoS works here because you are measuring the direct efficiency of specific advertising actions.
TACoS is your strategic, business-level decision metric. Use it when you are setting global advertising budgets, evaluating product viability, analysing growth trends or assessing the ROI of advertising across your total business. For example, if TACoS fell from 18% to 12% over 90 days while sales grew 40%, it indicates that advertising is driving organic momentum - you should increase the budget. TACoS works here because it captures the total impact on the business including advertising’s organic halo effect.
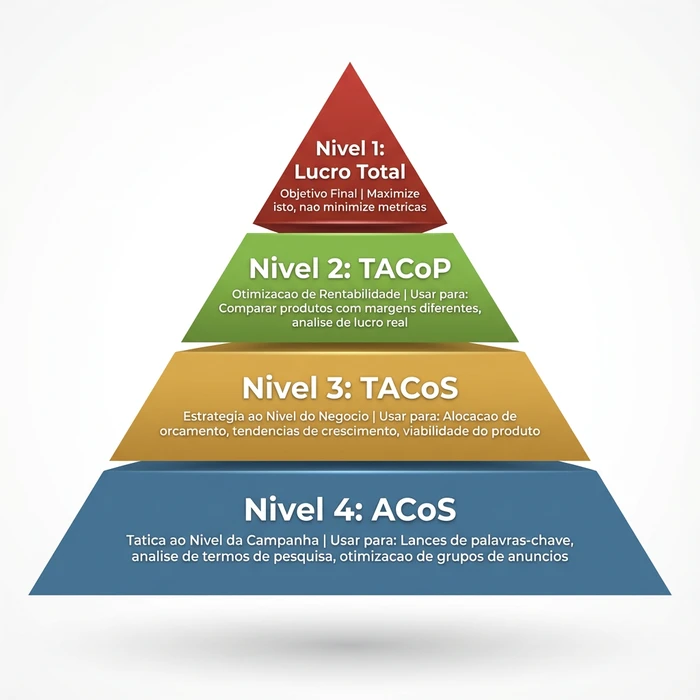
The strategic hierarchy of metrics showing which metric to use for different types of optimisation decisions
The decision matrix below shows exactly which metric to check for your specific optimisation task:
| I Need To... | Metric to Check | Why This Metric | Example Action |
|---|---|---|---|
| Adjust bids for specific keywords | ACoS per keyword/search term | Campaign-level efficiency | Keyword "amazon ppc tool" has 55% ACoS, reduce bid from 2.00 EUR to 1.50 EUR |
| Decide the overall monthly advertising budget | TACoS trend (90 days) | Business health indicator | TACoS fell from 20% to 14% while sales grew 35%, increase budget by 20% to capitalise on the momentum |
| Assess whether a new product launch is working | ACoS + Sales Volume + TACoS | Launch validation (efficiency + scale + total impact) | 60% ACoS is high but the sales volume validates demand, continue for another 60 days and monitor the TACoS decline |
| Determine whether a campaign is profitable | Actual ACoS vs Break-Even ACoS | Real profitability check | Break-even is 35%, campaign running at 32%, continue with the current strategy |
| Assess whether advertising is driving organic growth | Difference between ACoS and TACoS | Organic momentum indicator | ACoS is 28%, TACoS is 12%, the 16-point difference shows strong organic sales generated by the adverts |
| Compare performance across products with different margins | TACoP or Total Profit | Comparable profitability | Product A: 25% ACoS, 5,000 EUR profit. Product B: 40% ACoS, 8,000 EUR profit. B is better despite the higher ACoS |
| Decide whether I should pause/stop a campaign | Contribution to Total Profit | Ultimate value to the business | Campaign generates 12,000 EUR of monthly profit with 45% ACoS - do NOT pause despite the "high" ACoS |
| Set ACoS targets for multiple products | Break-Even ACoS per product | Product-specific profitability | Product A (40% margin) = 35% ACoS target. Product B (25% margin) = 20% ACoS target |
This matrix solves the confusion most sellers face: they check ACoS when they should check TACoS, or they use TACoS for tactical decisions better served by ACoS. Match the metric to the type of decision and you will avoid costly optimisation errors.
Why ACoS Alone Is a Dangerously Misleading Metric
Understanding ACoS’s limitations is critical for making profitable optimisation decisions. Most sellers treat ACoS as their primary success metric without realising it is fundamentally flawed for profitability analysis.
ACoS uses the gross sale price, not your actual revenue. Amazon deducts referral fees (typically 15%), FBA fees and taxes before you receive payment. For many products, sellers receive only 50% of the final sale price after all deductions. This means a 20% ACoS is actually consuming 40% of your net revenue, not 20%.
“It uses the final sale price which is subject to deductions (sales tax, Amazon referral fee, Amazon FBA fee). With sweet boxes, we may receive only 50% of the final sale price” - Amazon Advertising Optimisation Guidelines
ACoS ignores product margin, making generic benchmarks meaningless. A 30% ACoS is profitable for a product with a 35% margin but makes a loss on a product with a 25% margin. You cannot evaluate ACoS performance without knowing your product’s specific margin. The “aim for 30% ACoS” benchmark is dangerously misleading because it treats all products identically when profitability is product-dependent.
“20% ACoS is profitable for a product with a 25% gross margin but makes a loss on a product with an 18% gross margin. Consequence: it is impossible to say what a ‘good’ ACoS is because it depends on the product’s profitability” - Amazon Advertising Optimisation Guidelines
Calculate your break-even ACoS using this formula:
Example:
- Product Sale Price = 30.00 EUR
- COGS = 8.00 EUR
- Referral Fee (15%) = 4.50 EUR
- FBA Fee = 5.20 EUR
- Other Fees = 0.30 EUR
Total Amazon Fees = 10.00 EUR Net Revenue = 20.00 EUR Gross Profit = 12.00 EUR Product Margin % = 40% Break-Even ACoS = 40%
If your ACoS is below 40%, you are making a profit on every sale. If it is above 40%, you are losing money on every advert-generated sale. This is why generic benchmarks fail - your break-even point is unique to your product’s economics.
ACoS does not measure the effect of advertising on organic sales. Successful advertising improves organic placement through sales velocity and conversion signals. When you cut a campaign with a “high” ACoS, you may be eliminating the organic sales it was generating. This is why TACoS trends matter more than ACoS snapshots for strategic decisions.
“It does not account for the effect of advertising on organic sales” - Amazon Advertising Optimisation Guidelines
The real-world consequence is that sellers who optimise only for low ACoS frequently kill profitable growth. Reducing ACoS by cutting successful campaigns can decrease total profitability.
“This is a very poor objective for all the reasons above. It does not take profit into account and risks stopping profitable search terms to hit a false target” - Amazon Advertising Optimisation Guidelines on “Reducing ACoS”
Understanding TACoS as a Business Health Metric
TACoS trends reveal what is really happening with your total business, not just your advertising campaigns. The pattern of TACoS movement tells you whether advertising is building sustainable growth or creating advertising dependency.
Falling TACoS with stable or growing sales is the healthiest pattern. It indicates that advertising is successfully driving organic momentum. Your adverts are improving your organic placement, and organic sales are growing faster than advertising spend. This is sustainable, profitable growth.
Rising TACoS with growing sales means advertising is scaling proportionally with your business. You are growing, but remain heavily dependent on advertising. This is not necessarily bad for new products building market share, but it requires monitoring. If TACoS keeps rising, you are not building organic sustainability.
Falling TACoS with falling sales is a warning sign. You may have cut advertising spend, which made TACoS look better, but you lost total revenue. This is the “shrinking to profitability” mistake - you improved the metric while harming the business.
Stable TACoS with growing sales indicates healthy scaling. Advertising and organic are growing together proportionally. You are maintaining efficiency while expanding the total business.
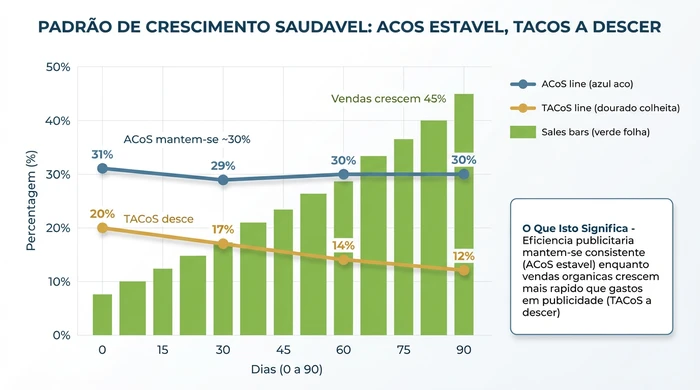
Healthy growth pattern showing stable ACoS with falling TACoS over 90 days, indicating that advertising is building organic momentum
TACoS benchmark targets vary by product lifecycle stage. New product launches typically run at 15-25% TACoS because you are investing heavily in visibility before organic momentum exists. Established mature products should aim for 7-15% TACoS because strong organic momentum reduces dependence on paid traffic. Seasonal products may deliberately accept higher TACoS during positioning periods (such as September-October for Christmas products) to build ranking before the peak season.
“Product launches, positioning a product before the peak sales period (e.g.: positioning sweet boxes in September/October in preparation for the pre-Christmas sales peak)” - Amazon Advertising Optimisation Guidelines on tactical exceptions
The TACoS improvement trap: falling TACoS sounds positive, but it can indicate under-investment. If you cut advertising spend by 50% and TACoS falls from 20% to 12%, but total sales also fall 30%, you have not improved - you have shrunk. Always evaluate TACoS trends alongside total sales and total profit trends.
Advanced Metrics: TACoP and Total Profit
Beyond ACoS and TACoS there are metrics that measure real profitability instead of cost-efficiency ratios.
TACoP (Total Advertising Cost of Profit) measures advertising spend relative to actual profit after all costs. The formula is Ad Spend / (Total Profit), where profit equals revenue minus COGS, Amazon fees and FBA fees. TACoP is superior to both ACoS and TACoS because it measures advertising cost against real profit, not gross sales.
“A much better metric. More laborious to calculate but, when the data is not combined, it truly reflects performance. It calculates advertising spend relative to organic + advertised sales” - Amazon Advertising Optimisation Guidelines
TACoP stands out when comparing performance across products with different margins. Product A may have 25% ACoS generating 5,000 EUR of profit, while Product B has 40% ACoS generating 8,000 EUR of profit. Looking only at ACoS suggests Product A performs better. Looking at total profit reveals Product B is superior despite the higher ACoS.
Total Profit is the ultimate metric. ACoS and TACoS are efficiency metrics, but profit is the real objective.
“Preferred metric. Increasing global profit after advertising deduction is the ultimate goal. Requires judgement on long-term vs short-term profit optimisation priority” - Amazon Advertising Optimisation Guidelines
A campaign with 60% ACoS that generates 10,000 EUR of profit is better than a campaign with 20% ACoS that generates 3,000 EUR of profit. The strategic principle is to maximise total profit, not minimise percentage metrics. Sellers who chase low ACoS numbers frequently reduce overall profitability in the process.
Common Mistakes: What NOT to Do
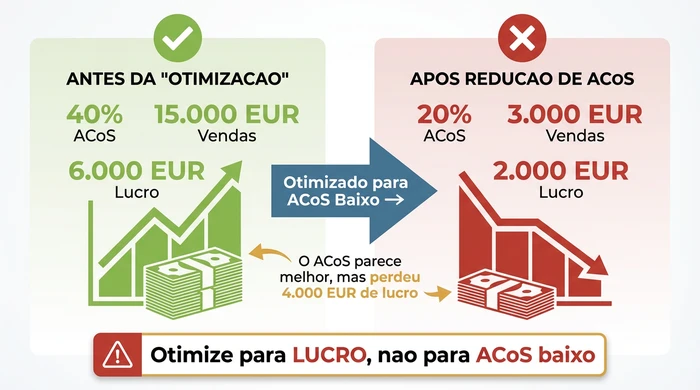
Real example showing how reducing ACoS from 40% to 20% actually decreased total profit by 4,000 EUR
Using the same ACoS target across all products creates systematic profitability errors. Different products have different margins. Product A with a 40% margin can sustain 35% ACoS profitably. Product B with a 20% margin loses money at 25% ACoS. Calculate the break-even ACoS for each product based on its specific margin and set targets accordingly.
Treating generic benchmarks as universal targets ignores the fundamental reality that profitability depends on your product’s specific economics. “30% ACoS is good” is only true if your margin is above 30%. Set targets based on your actual margins and profit objectives, not industry averages.
Optimising to reduce ACoS without considering the impact on total profit leads to destructive decisions. Cutting a campaign from 40% ACoS to 25% ACoS sounds good, but if sales fall from 10,000 EUR to 3,000 EUR, you reduced total profit from 6,000 EUR to 2,250 EUR. Evaluate optimisation changes based on their impact on total profit, not on ACoS movement.
Ignoring the relationship between ACoS, TACoS and organic sales misses the most valuable signal in your data. When ACoS and TACoS diverge significantly, advertising is driving organic growth. Optimising ACoS alone can kill organic momentum. Monitor both metrics together and evaluate total sales trends.
Combining data from multiple products in ad groups makes profitability analysis impossible. When multiple products are in an ad group, you cannot determine which product is responsible for impressions, clicks, spend or sales. You cannot calculate accurate ACoS or TACoS per product, and you cannot identify which product pages need optimisation. Use single-product ad groups for accurate attribution and optimisation.
Variations and Exceptions
Frequently Asked Questions
Q: What is the difference between ACoS and TACoS on Amazon?
ACoS (Advertising Cost of Sales) measures advertising spend relative to sales attributed to adverts only, calculated as (Ad Spend / Ad Sales) x 100. TACoS (Total Advertising Cost of Sales) measures advertising spend relative to all sales including organic, calculated as (Ad Spend / Total Sales) x 100. TACoS is always lower than ACoS and reveals the total impact of advertising on your business, including the organic sales momentum it creates.
Q: What is a good TACoS percentage for Amazon sellers?
Aim for 7-15% TACoS for established mature products with strong organic momentum. New product launches typically run at 15-25% TACoS while they build visibility and placement. Lower is not always better - if you are under-investing in advertising, you may be leaving profitable growth on the table. The right TACoS depends on your product’s lifecycle stage and growth objectives.
Q: How is TACoS calculated?
Divide your total advertising spend by your total sales and multiply by 100. Get Ad Spend from the Amazon Advertising Console and Total Sales from the Business Reports in Seller Central. For example, if you spent 500 EUR on adverts and generated 3,500 EUR in total sales (including adverts and organic), your TACoS is (500 EUR / 3,500 EUR) x 100 = 14.3%.
Q: Is TACoS more important than ACoS?
Neither is universally more important - they serve different purposes. Use ACoS for tactical campaign-level decisions such as keyword bids and search term optimisation. Use TACoS for strategic business-level decisions such as global budget allocation, product viability assessment and growth trend analysis. The mistake is using a single metric for every decision instead of matching the metric to the type of decision.
Q: How can I improve my TACoS on Amazon?
Falling TACoS happens when organic sales grow faster than advertising spend. Improve TACoS by optimising your listings to convert better (boosting organic placement), building external traffic sources, leveraging advertising to improve organic placement through sales velocity signals, and ensuring your adverts target high-intent keywords that drive lasting ranking improvements. Focus on building organic momentum rather than just reducing advertising spend, which can shrink your total business.
Conclusion
ACoS and TACoS are not competing metrics - they form a strategic hierarchy where each serves specific types of decisions. The mistake is not tracking the wrong metric, it is using a single metric for every decision or optimising metrics without considering the impact on total profit.
Start by calculating your break-even ACoS based on product margin using the formula provided above. Use ACoS for tactical campaign optimisation decisions such as keyword bids and search term analysis. Monitor TACoS trends for business health and strategic budget allocation. Always evaluate changes based on their impact on total profit, not just on the movement of percentage metrics.
For sellers serious about search-term-level profitability optimisation, tools like AdRazor can help consolidate search term analysis while tracking ACoS and TACoS trends across your entire account. The platform removes Amazon’s 60-day data limitation and shows exactly which search terms are profitable using the correct level of optimisation.
The difference between your ACoS and TACoS reveals the hidden value of advertising - the organic momentum it creates. Do not kill that momentum by chasing low ACoS numbers. Optimise for profit, not for vanity metrics.